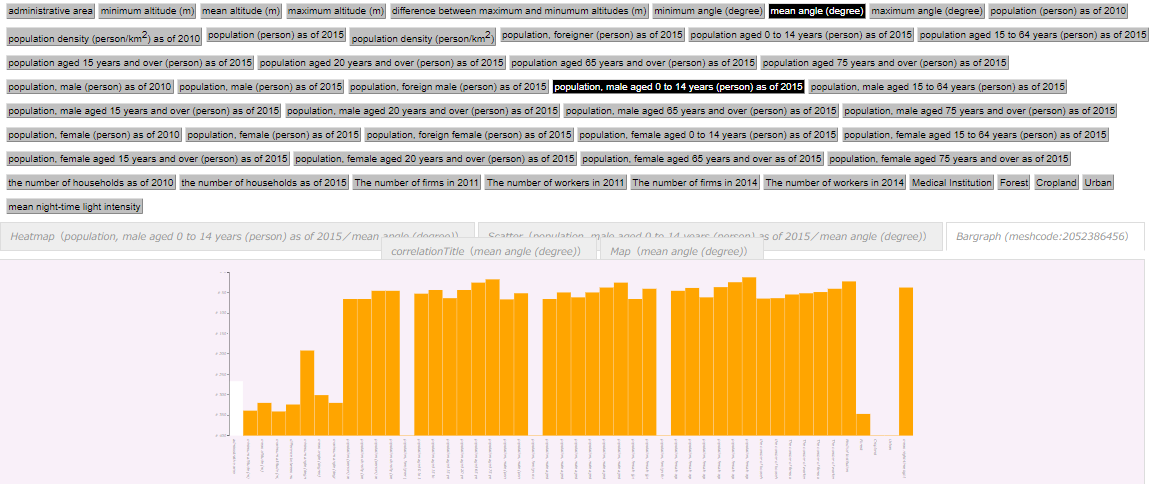
Select one world grid square statistics or data from the list of available world grid square statistics and data. By using the bargraph function, you can
understand trends in the selected world grid square and the values of the included features. You can use this function to identify features if you use heatmap, scatter, and map. If you want to use this function, please select bargraph from the tab.
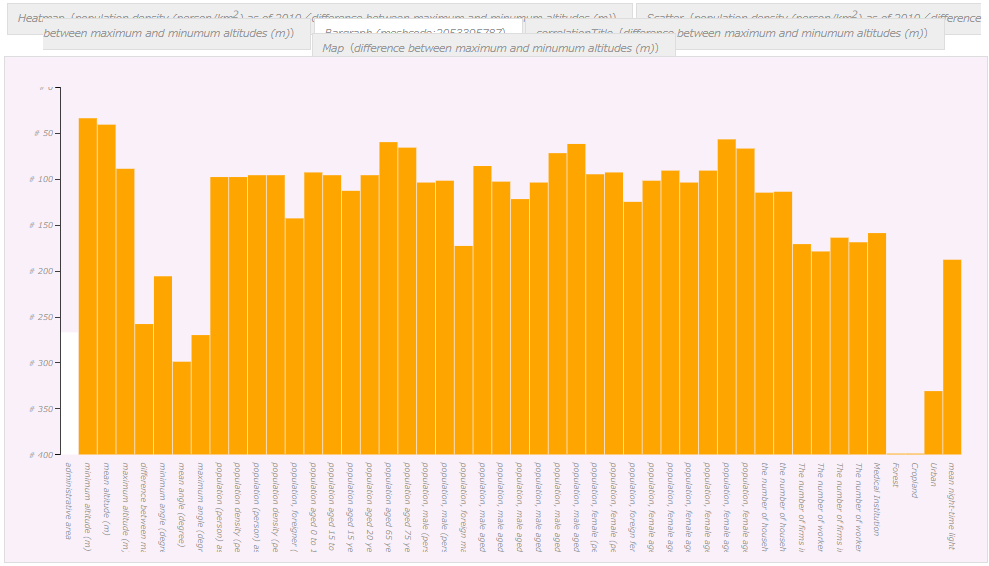
In the following figure, for example, all the features at world grid square 2052354610 are displayed.
 In the following figure, for example, all the features at world grid square 2052354610 are displayed.