Use this function by selecting one world grid square statistic or data from the data list. The correlation coefficiets of values between selected world grid square statistics or data and other world grid square statistics or data are computed and displayed as bar graphs. The correlation coefficient takes a value between -1 and 1. A positive value closer to 1 of the correlation coefficient represents that the two values tend to be similar. A negative values closer to -1 of the correlation coefficient represents that two values tend to be opposite. If the correlation coefficient takes 0, then two values are uncorrelated and have no relationship.
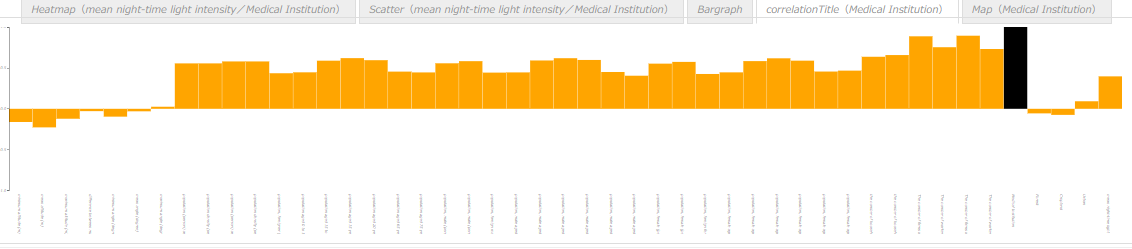
In the following figure, an example represents correlation coefficiets between the 2012 night-time light intensity and others. A place where night-time light intensity is strong tends to be at lower elevation levels because there is a negative correlation coefficients are seen in the bar graph.
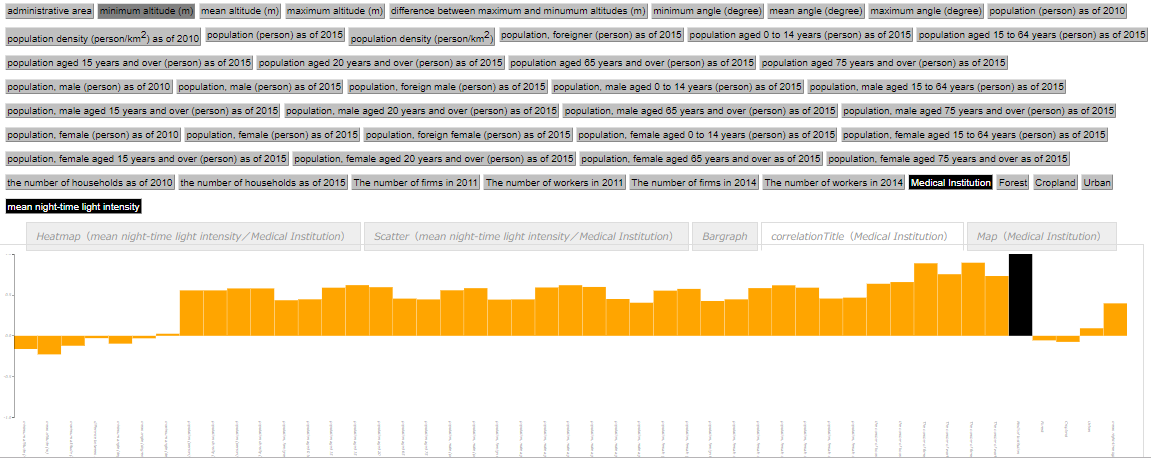 In the following figure, an example represents correlation coefficiets between the 2012 night-time light intensity and others. A place where night-time light intensity is strong tends to be at lower elevation levels because there is a negative correlation coefficients are seen in the bar graph.