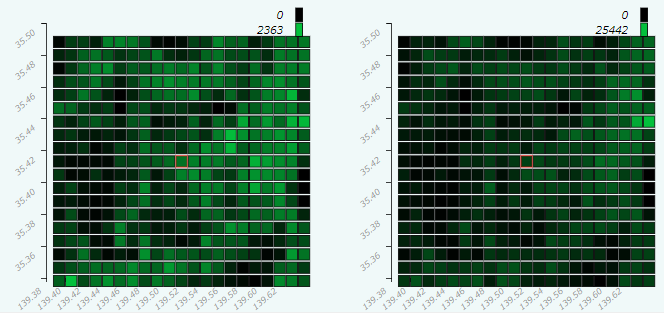
 In the following figure, for example, the 2015 female population (population cencus) aged 0-14 and 2010 population are displayed. You can compare two types of world grid square statistics and data in the same selected area visually.
In the following figure, for example, the 2015 female population (population cencus) aged 0-14 and 2010 population are displayed. You can compare two types of world grid square statistics and data in the same selected area visually.