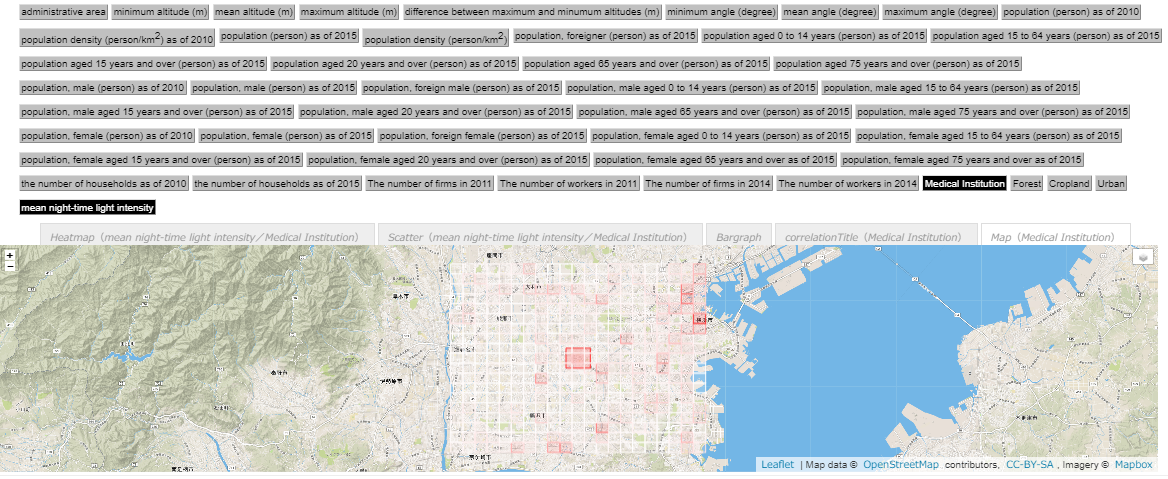
 In the following figure, for example, you can select the 2010 population (cencus population) to display their values of world grid square statistics on the map.A detailed value are displayed in a pop-up windows by selecting a world grid square.
In the following figure, for example, you can select the 2010 population (cencus population) to display their values of world grid square statistics on the map.A detailed value are displayed in a pop-up windows by selecting a world grid square.
