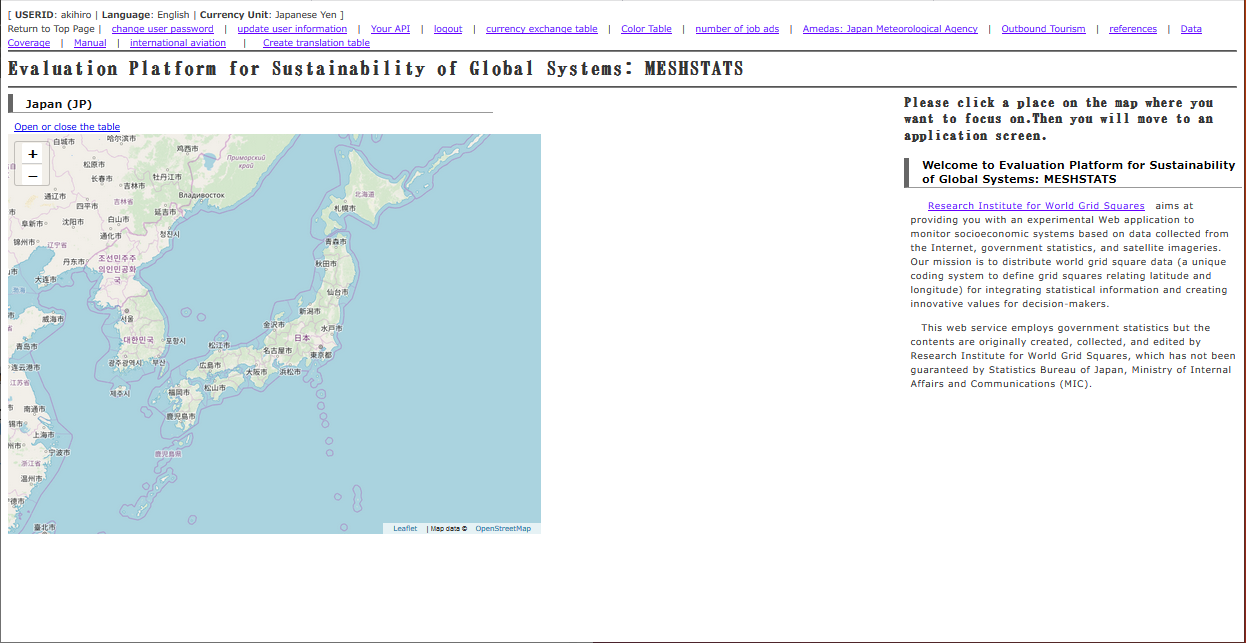
 2. When you log in, you will see the top page as shown below.
2. When you log in, you will see the top page as shown below.
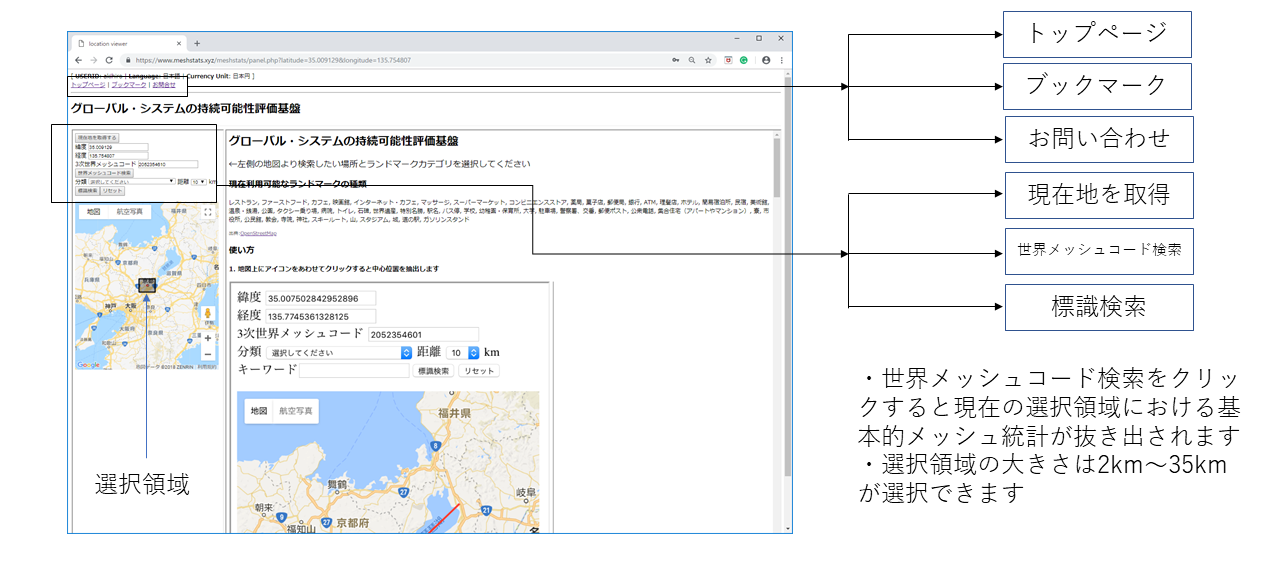 4. If you click [Get your current geographic location], then you see a permission to send your location. If allowed, it will move to an area centered on your current location.
5. In Google Map, select an area on the map and set a type of target object from the categories. If you press [Search objects], then the search for landmarks you want to use will start and the landmarks appear on the map of the left hand side. Click on a landmark and a pop-up window including a clickable link appears on the map of the left hand side. If you click on the link, the data retrieving around landmarks will start. You will see the data and analysis software in the panel of the right hand side. If you click on [Search worldmesh Code] in both Google Map and ESRI maps, the data in the currently selected region begins to be retrieved from the database. Then, you will see the data and analysis software in the panel of the right hand side.
4. If you click [Get your current geographic location], then you see a permission to send your location. If allowed, it will move to an area centered on your current location.
5. In Google Map, select an area on the map and set a type of target object from the categories. If you press [Search objects], then the search for landmarks you want to use will start and the landmarks appear on the map of the left hand side. Click on a landmark and a pop-up window including a clickable link appears on the map of the left hand side. If you click on the link, the data retrieving around landmarks will start. You will see the data and analysis software in the panel of the right hand side. If you click on [Search worldmesh Code] in both Google Map and ESRI maps, the data in the currently selected region begins to be retrieved from the database. Then, you will see the data and analysis software in the panel of the right hand side.
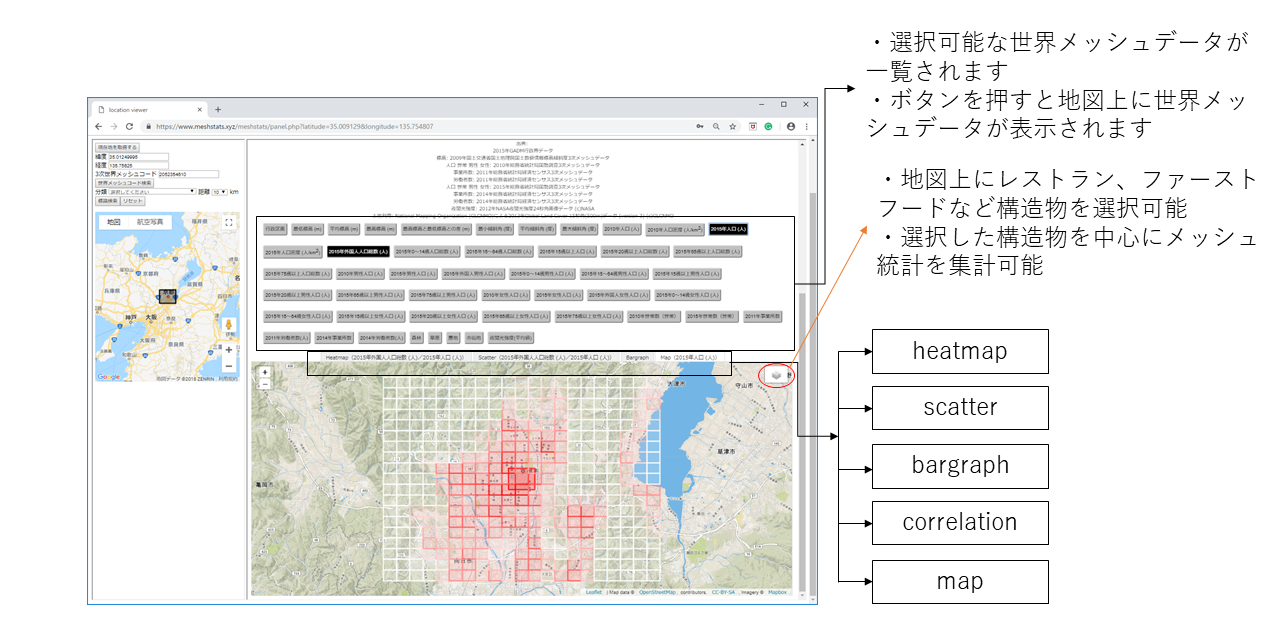
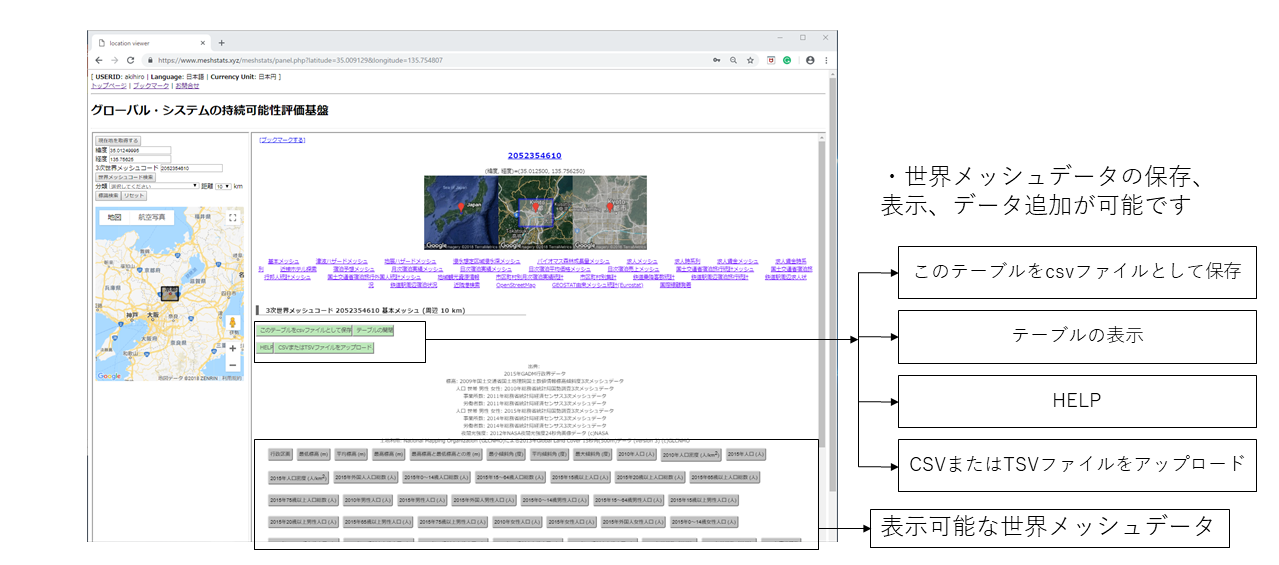 6. if you press the gray box to be displayed in the panel of the right hand side, world grid square statistics which you selected display on the map. This analysis type is called map. The system provides five types of analysis types such as heatmap, scatter, correlation, and bargraph. You can access various types of data and analysis functions. For more information, see How to use the data acquisition screen and Available functions.